How Many Valves Go Into a 1 GW Liquid-Cooled Data Center?
Key Takeaway
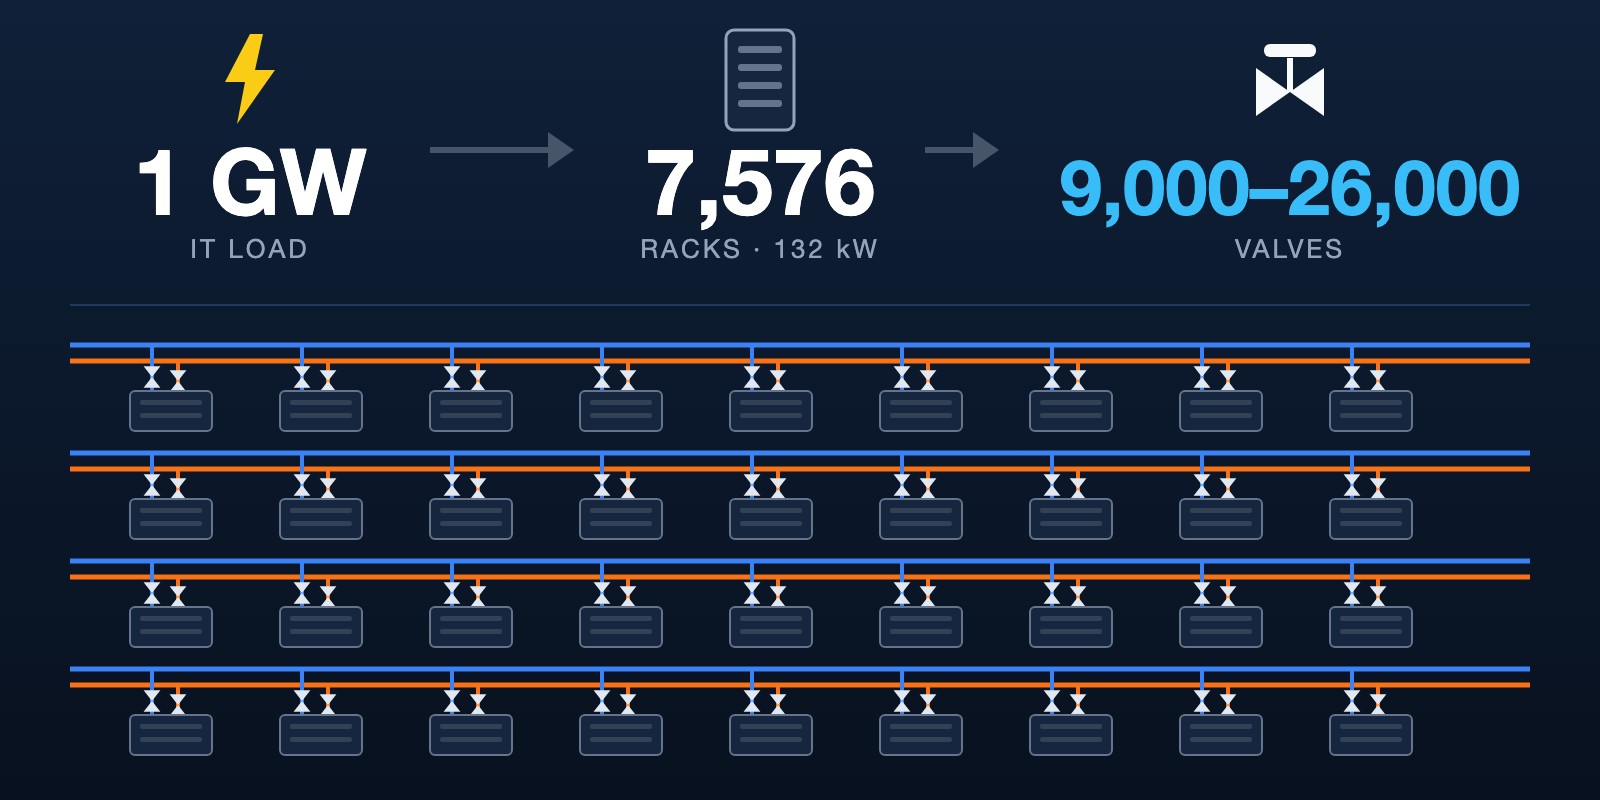
About 9,000 to 26,000 valves for every 1 GW of IT load, counting only the liquid loop that serves the racks (132 kW per rack).
We found no public source for this number, so we worked it out from the rack count and one public example. A handy rule: about 3.4 valves per rack.
The biggest group is the isolation valve on each rack’s supply and return pipe. Vertiv says manufacturers typically use “an isolation valve (such as a ball valve)” there, so that is the first place to look for ball valves in the count.
How many valves is that?
Between 9,000 and 26,000. The low end leaves out the valves on each rack’s pipes.
| Where | Valves per 1 GW | How we got it |
|---|---|---|
| Rack drops (the pipes into each rack) | about 15,000 | 2 per rack × 7,576 racks. Vertiv names a valve at the rack inlet; the second, on the return, is our assumption |
| CDU and row manifolds | about 9,000 to 11,000 | Scaled up from one public example |
| Facility-water side | not counted | No public figure found |
| Total | 9,000 to 26,000 | Low end has no rack-drop valves |
Per rack, that is 2 valves on the rack’s own pipes plus about 1.4 at CDU and row level, so about 3.4 valves per rack.
What does “1 GW” mean here?
1 GW of IT load, which is the power the racks themselves use. Cooling and electrical losses come on top, so 1 GW at the grid connection holds fewer racks.
H2X Engineering gives 132 kW for a GB200 NVL72 rack. At that density 1 GW holds about 7,576 racks (1,000,000 kW ÷ 132 kW).
Where do the valves sit?
At the CDU, along the row manifold, and on the pipes into every rack. The Open Compute Project calls this the technology cooling system (TCS) loop: the row manifold, the rack manifolds and the secondary side of the CDUs.
- CDU. Airedale’s CDU lists “Isolation valves for supply and return”.
- Rack pipes. Vertiv’s liquid cooling white paper says the connection to the in-rack manifold “must also have an intermediary isolation valve”. OCP’s guideline says that during pressure testing “the valves on the drop downs should be closed”. Cold-plate channels are only about 100 microns wide, so debris has to be kept out.
- Row manifold. OCP’s flushing steps isolate valves “to ensure velocity flush through each leg of the system”, so the row piping has isolation valves too.
None of these sources gives a quantity. They show where valves are, not how many.
Where do the 9,000 to 11,000 come from?
From one example bill of materials on the TCS reference page at intelaccelerator.com. It lists 5 CDUs of 2.5 MW (12.5 MW installed), 80 racks and 114 valves at CDU and row level: 26 control or balancing valves and 88 isolation, check or drain valves.
That is 9.1 valves per installed MW, or 1.4 per rack. Scaled to 1 GW, it gives about 9,100 to 10,800. The page says “All figures shown are demo data for structural demonstration” and does not say whether rack-level valves are included, so we treat them as excluded.
Why does rack density matter?
Denser racks mean fewer valves per gigawatt. Rack-drop valves follow the number of racks, and 1 GW of 40 kW racks is 3.3 times as many racks as 1 GW of 132 kW racks.
| Rack density | Racks per 1 GW | Rack-drop valves (2 per rack) | Total with CDU and row (about 9,100) |
|---|---|---|---|
| 40 kW (H100-class, per H2X) | 25,000 | 50,000 | about 59,000 |
| 132 kW (GB200 NVL72, per H2X) | 7,576 | 15,152 | about 24,300 |
The 40 kW row assumes every rack is liquid-cooled, which a real hall may not be.
Why is a single valves-per-megawatt number hard to trust?
Because it swings with three things.
- Rack density changes the biggest term by 3.3 times, as the table shows.
- Whether rack drops are counted. The public example appears to leave them out.
- The only public count is demo data, not a survey of built halls.
When you see a valves-per-megawatt figure, ask which rack density and which scope are behind it.
How many of them are ball valves?
No public source gives a ball valve count, so we do not give one. What we can show is where ball valves are most likely to sit.
Vertiv’s white paper says: “Typically, manufacturers use an isolation valve (such as a ball valve) placed between the secondary fluid network piping and the in-rack manifold’s inlet.” That is the rack-drop group, about 15,000 per gigawatt under our two-per-rack assumption. Read that figure as the size of the group where ball valves usually go, not as a ball valve count.
Other positions are less clear. Vertiv gives typical header piping as 150 to 300 mm (3 to 6 in) and branch piping as 25 to 50 mm (1 to 2 in), so valve sizes in the loop span a wide range. Which valve type suits each size is a design decision, and no source we read splits them.
Material is the other half of the question. OCP’s row-manifold guideline expects pipework in “stainless steel, minimum grade 304”, and its propylene glycol guideline prefers 304L, 316L or higher grades for wetted metals. A stainless steel ball valve in those grades fits both. For the reasoning, see brass or stainless in a glycol cooling loop and why data centers choose 3-piece ball valves.
What does this count leave out?
- Facility water. Chiller, tower and primary-header valves. We found no public figure.
- Valves inside the CDU. Airedale lists isolation valves as part of its CDU. Check each vendor’s scope so you do not count them twice or miss them.
- Valves inside the rack. Each rack has its own rack manifold. Whether it has valves depends on the rack vendor, and no source we read says.
- A market-report check. Our market model gives about $37 million of valves per gigawatt of new US capacity. Divided by 9,000 to 26,000 valves, that is about $1,400 to $4,100 per valve. The two models use different inputs, and public data cannot reconcile them.
How do you count your own project?
- Divide the IT load by kW per rack to get the rack count.
- Count the valves on each rack’s supply and return pipes, plus any inside the rack manifold.
- Count the CDU connections from the datasheet, and note which valves come inside the CDU.
- Count the isolation points, drains and vents on each row manifold.
- Count the facility-water side separately. Then group every valve by size and duty (isolating or controlling) to get your own ball, butterfly and other split.
Frequently Asked Questions
How many ball valves are in a 1 GW liquid-cooled data center?
No public source says. The rack drops are the largest group, about 15,000 per GW at two per rack, and Vertiv says an isolation valve “such as a ball valve” typically sits there. That is the size of the group, not a ball valve count.
How many valves per megawatt does a liquid-cooled data center need?
About 9 per MW at CDU and row level, plus 2 per rack on the rack pipes. At 132 kW per rack that is roughly 9 to 26 per MW in total. These are derived figures, not published ones.
Does 1 GW mean grid power or IT load?
This page uses IT load. Grid power also covers cooling and electrical losses, so the same connection supports fewer racks and fewer valves.
Does the CDU include its own valves?
Airedale’s does: it lists isolation valves for supply and return. Other vendors differ, so confirm what is inside each CDU before counting field valves.
What are liquid cooling ball valves made of?
OCP’s row-manifold guideline expects stainless steel pipework, minimum grade 304. OCP’s propylene glycol guideline prefers 304L, 316L or higher grades for wetted metals. A stainless steel ball valve in those grades fits both.
Is 132 kW per rack a fixed figure?
No. H2X Engineering gives 132 kW for a GB200 NVL72 rack and about 40 kW for an H100-class rack. Rack power rises with each generation, and the valve count per gigawatt falls with it.
Related Articles
- The Data Center Valve Market to 2035: Building the Number From Gigawatts Up
- Why AI Data Centers Choose 3-Piece Ball Valves Over 2-Piece
- Why Are Data Center Cooling Valves Electric Rather Than Pneumatic?
- Why Are Coolant Loops Adopting Sanitary Piping Rules?
- Brass or Stainless in a Glycol Cooling Loop? What the OCP Guideline Says
- What Happens When a Ball Valve Fails in a Data Center Cooling Loop?
- Stainless Steel Ball Valve OEM Manufacturer in Taiwan
Referenced sources: Open Compute Project, Guidelines for Pre-Commission Preparation of Technology Cooling System (TCS) Row Manifolds in Liquid Cooled Data Centers, version 1.0; Airedale, 400kW - 2MW+ Coolant Distribution Unit (CDU); H2X Engineering, Data Center Liquid Cooling Design for Direct-to-Chip Racks; Vertiv, Deploying liquid cooling in the data center: a guide to high-density cooling (white paper, 2024); TCS / Liquid Cooling Loop reference page, intelaccelerator.com.
OCP and Vertiv quotations were read from the PDF text layer, so check them against the documents. The other pages were read on 19 November 2026. All per-gigawatt figures here are arithmetic on these sources, not published counts.