The Data Center Valve Market to 2035: Building the Number From Gigawatts Up
Key Takeaway
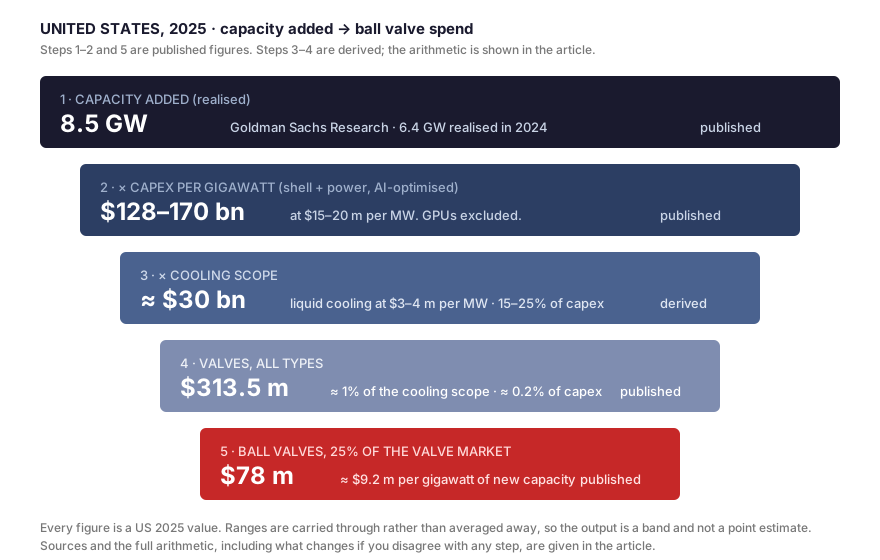
The United States added 8.5 GW of data centre capacity in 2025 and has 13.6 GW scheduled for 2026, against a disclosed pipeline of 331 GW and an interconnection queue of roughly 2,600 GW. At $15–20 m per MW for an AI-optimised shell and power, 8.5 GW represents $128–170 bn of construction, of which the cooling scope is 15 to 25 percent. Against that, the entire US data centre valve market was $313.5 m in 2025, which works out at roughly $37 m of valves per gigawatt built, or about 1 percent of the cooling scope. Ball valves hold 25 percent of that market, around $78 m in the US and $275 m worldwide. Published forecasts put the global data centre valve market at $4.04 bn by 2035, with the ball valve share easing to 24 percent, or roughly $970 m.
How much US capacity exists, and how much is only announced?
The gap between these two numbers is the single most misread figure in this market, so it is worth separating them carefully.
| Measure | Figure | Source |
|---|---|---|
| US data centre power demand, 2025 | 31 GW | Goldman Sachs Research |
| Capacity realised, 2024 | 6.4 GW | Goldman Sachs Research |
| Capacity realised, 2025 | 8.5 GW | Goldman Sachs Research |
| Scheduled for 2026 | 13.6 GW | Goldman Sachs Research |
| Scheduled for 2027 | 36.3 GW | Goldman Sachs Research |
| Share of next-year schedule expected on time | ≈ 60% | Goldman Sachs Research |
| Share expected on time two years out | ≈ 50% | Goldman Sachs Research |
| Cumulative disclosed US pipeline | 331 GW | industry census data |
| National interconnection queue | ≈ 2,600 GW | queue reporting, 2026 |
| PJM first reformed queue cycle | 220 GW / 811 projects | PJM, May 2026 |
Read down that column and the shape of the market becomes clear. Announcements run roughly forty times ahead of delivery. The pipeline is a register of intent rather than a forecast of construction, and much of it is waiting on electricity rather than on concrete.
That is the honest answer to how much capacity is ordered but cannot be built. The binding constraint is grid interconnection, not construction capacity. Queue waits of four to seven years are reported in Northern Virginia, Phoenix and Dallas, which means a campus entering the queue in 2026 is unlikely to draw utility power before 2030 at the earliest, however fast the building itself goes up.
For anyone sizing a component market off these numbers, the operative figure is realised additions, not the pipeline. Using 331 GW would overstate valve demand by a factor of roughly forty.
What does a gigawatt cost?
Three different numbers circulate, and they are not interchangeable.
- Conventional cloud facility: $10–12 m per MW.
- AI-optimised shell and power: $15–20 m per MW, so $15–20 bn per gigawatt.
- All-in, including GPUs and tenant fit-out: $30–40 m per MW. A single 1 GW AI campus is quoted at around $38 bn on this basis.
This article uses the middle figure. GPUs are a semiconductor purchase that happens to sit inside a building, and including them roughly doubles the denominator, making every downstream percentage look half as large without changing a single dollar of valve spend. Check which definition a study uses before comparing its component shares with anyone else's.
How much of that is cooling?
Mechanical and cooling scope is generally put at 15 to 25 percent of data centre construction cost, against 40 to 50 percent for electrical. Two independent ways of reaching the cooling number agree closely.
Taking the percentage route, 20 percent of $17.5 bn per gigawatt gives $3.5 bn. Taking the unit-cost route, liquid cooling infrastructure is quoted at $3–4 m per MW against $1.5–2 m per MW for air, and $3.5 m per MW across a gigawatt is also $3.5 bn. The two methods land in the same place, which is a reasonable indication that the band is sound.
Within that scope, coolant distribution units are quoted at roughly $500–800 per kW of cooling capacity and direct-to-chip systems at $3,500–5,000 per kW at rack scale. Applied to 8.5 GW of 2025 additions, the cooling scope comes to roughly $26–34 bn.
How much of the cooling is valves?
Here the published research stops describing systems and starts describing components, and the numbers get much smaller.
The US data centre valve market was $313.5 m in 2025. Divide that by the 8.5 GW realised in the same year and the result is approximately $36.9 m of valves per gigawatt of new capacity. Against a cooling scope of about $3.5 bn per gigawatt, valves are roughly 1 percent of the cooling package and about 0.2 percent of shell-and-power capex.
That division is the weakest step in this cascade and it should be treated as such. A market-year revenue figure and an installation-year capacity figure are not perfectly aligned: valves are bought months before a facility energises, retrofit and replacement demand sits inside the market number but not inside the capacity number, and some of it serves facilities that slip well past the schedule they were bought against. The result is a reasonable order of magnitude rather than a precise ratio.
It is still worth doing. One percent of the cooling package explains why valve selection rarely appears in a capex discussion and why it appears immediately in a failure review.
Which valve types, and how much each?
Published segmentation of the global market, with dollar values calculated from the stated shares:
| Valve type | 2025 share | 2035 share | CAGR | 2025 global | 2035 global |
|---|---|---|---|---|---|
| Ball | 25% | 24% | 13.0% | $275 m | $970 m |
| Butterfly | 20% | 22% | 15.5% | $220 m | $889 m |
| Control (smart) | 15% | 16% | 16.5% | $165 m | $646 m |
| Globe | 15% | 14% | 12.5% | $165 m | $566 m |
| Gate | 15% | 13% | 11.0% | $165 m | $525 m |
| Check | 10% | 11% | 14.0% | $110 m | $444 m |
| Total | 100% | 100% | 13.9% | $1.10 bn | $4.04 bn |
Ball valves remain the largest single type across the whole period, but the share drifts down while butterfly and smart control valves take share. The direction is consistent with the physics: as loops get larger and more instrumented, large-bore isolation moves toward butterfly and modulating duty moves toward control valves, while ball valves hold the small-bore isolation work that grows with rack count rather than with pipe diameter.
Gate and globe valves lose share on the same logic in reverse. Both belong to an older facility-water vocabulary and neither has a natural role in a secondary coolant loop.
Where do ball valves actually sit?
Two research houses appear to contradict each other here, and the contradiction is instructive rather than a data error.
One puts ball valves at the top of the data centre valve market with 25 percent. The other, looking specifically at liquid cooling valves, expects butterfly valves to hold the largest share by value. Both can be correct because they are describing different parts of the same building.
Butterfly valves lead by value where the pipe is large, which is facility water: chiller headers, riser mains, the primary side of a coolant distribution unit. Ball valves lead by count and hold their value share where the pipe is small and the isolation points are numerous, which is the secondary loop: rack manifolds, branch isolation, CDU secondary connections, and the service isolation that sits behind every quick disconnect. A gigawatt of direct-to-chip capacity adds a modest number of large butterfly valves and a very large number of small ball valves.
That also explains the divergence in the growth rates. Butterfly grows with installed megawatts. Ball grows with rack count and isolation-point density, which is why the loop application that contains most of them, liquid cooling loops at the CDU, is the fastest-growing application segment in the published data at 17.5 percent CAGR, rising from 25 percent of the market in 2025 to 30 percent in 2035.
A useful cross-check
Two independent sources agree on the size of the liquid cooling valve market today, which is worth noting because agreement of this kind is uncommon in component research.
Applying the 25 percent liquid-cooling-loop application share to the $1.10 bn global valve market gives $275 m for 2025. A separate study that sizes data centre liquid cooling valves directly puts the 2025 figure at $270 m. Two different methodologies, a difference of under 2 percent.
Where they part company is the slope. The second study projects $1.80 bn by 2032 at a 30.8 percent CAGR. The first implies roughly $1.21 bn by 2035 from the application segment. Those are very different futures from the same starting point, and the gap is a fair statement of how uncertain this forecast is. A buyer planning capacity against the higher curve is planning for something closer to a fivefold increase by 2032; against the lower curve, a doubling by 2035.
The 2035 picture
| Segment | 2025 | 2035 | CAGR |
|---|---|---|---|
| Global data centre valves, all types | $1.10 bn | $4.04 bn | 13.9% |
| North America | $418 m (38%) | $1,535 m | 13.89% |
| United States | $313.5 m | $1,151 m | 13.89% |
| Ball valves, global | $275 m | $970 m | 13.0% |
| Ball valves, United States | $78 m | $276 m | 13.0% |
| Liquid cooling loop application | 25% of market | 30% of market | 17.5% |
| Hyperscale end-use | 40% | 45% | 16.5% |
Expressed per gigawatt, at the 2025 ratio, a gigawatt of new US capacity carries roughly $37 m of valves of all types and roughly $9.2 m of ball valves. Those ratios will not hold flat to 2035. Rack density is rising faster than floor area, which raises isolation-point density per megawatt, while unit prices in a maturing component market tend to fall. The two effects push in opposite directions and the published forecasts do not separate them.
Re-running the model
Five inputs drive everything above. Changing any of them changes the answer, and each is a legitimate point of disagreement:
- Realised GW, not pipeline GW. Substituting the 331 GW disclosed pipeline for 8.5 GW realised inflates every downstream number by roughly forty times.
- Which capex definition. Shell and power, or all-in with GPUs. This halves or doubles every percentage.
- Cooling share. The 15 to 25 percent band is wide, and a facility at 60 kW per rack sits at a different point in it than one at 15 kW.
- The valve-per-gigawatt ratio. Derived here by division and the least robust step.
- Which growth curve. 13.9 percent for the whole valve market, 17.5 percent for the CDU application, or 30.8 percent for liquid cooling valves specifically.
Substitute your own figure for any of them and carry it down the cascade. That is why the arithmetic is set out rather than summarised.
Frequently Asked Questions
The short version:
Size this market off realised gigawatts, not the announced pipeline, or you will be out by a factor of forty. A gigawatt of new US capacity carries roughly $37 m of valves of all types, about 1 percent of its cooling scope, of which ball valves are about $9.2 m. Ball valves are the largest single type at 25 percent of a $1.10 bn global market, easing to 24 percent of a forecast $4.04 bn by 2035. Where they sit matters more than the headline share: butterfly leads by value on large facility water pipe, ball leads at the rack manifold and branch isolation points that multiply with rack count.
Sources: US capacity realised and scheduled, execution probability and power demand from Goldman Sachs Research (US data center power demand). Data centre valve market size, segmentation by type, function, application, end-use and region from Precedence Research. Data centre liquid cooling valve market size and CAGR from MarketsandMarkets. Liquid cooling market context from Dell'Oro Group. Interconnection queue figures from PJM's May 2026 reformed cycle and 2026 national queue reporting. Capex per MW, cooling share of capex, CDU and direct-to-chip unit costs are drawn from published construction cost benchmarks for 2026 and are quoted as ranges because the underlying studies differ in scope.
What is derived rather than published: the valve spend per gigawatt, the valve share of the cooling scope, the valve share of capex, and all dollar values by valve type. Dollar values by type are calculated by applying the published percentage shares to the published market totals; the studies publish shares and totals but not the products. The per-gigawatt figures divide a market-year revenue figure by an installation-year capacity figure, which introduces timing error in both directions. Forecasts to 2035 are the cited studies' own projections and are not independent estimates. Market research figures from different houses use different scope definitions and should not be combined without checking those definitions.